
Decision First
What this screen is for, before which charts exist.
Most dashboards are built from what the data warehouse can produce rather than from what anyone needs to decide, so they become inventories of available metrics. Dashboard UX design starts from the opposite end: what decision is this screen for, what would change it, and what can therefore be left off.
A dashboard nobody acts on is a report with a refresh button.
What this screen is for, before which charts exist.
What is abnormal, surfaced — not twelve equal tiles.
A number without a baseline cannot be interpreted.
From "something is wrong" to "here is what".
Removing charts is usually what makes a dashboard useful.
A dashboard exists to support a decision. If someone looks at it and does not know what to do differently, it has failed regardless of how much data it displays. These checks test that rather than visual sophistication.
Metric definitions cause more disputes than any design decision. When two teams read the same figure differently, the dashboard stops being a shared reference and becomes something each department argues with. Definitions visible at the point of use resolve this permanently.
Four reasons, and all four are design decisions.
Discuss Your Dashboard →Twelve tiles of the same size, so nothing stands out.
A number with nothing to compare it to means nothing.
Something is wrong and the screen offers no way to investigate.
Assembled from what exists rather than what is needed.
The decision, the hierarchy, and the route from signal to cause.
For internal tools generally, see B2B UX design. For internal tools generally this sits alongside B2B UX design; query performance behind slow dashboards is database development.
Ask what would change as a result of looking. If nothing, the chart does not belong.
What action this screen supports.
Only those that would change the decision.
Prominence by consequence, not by tile grid.
From anomaly to cause.
The charts nobody uses, which is usually most of them.
Dashboards serve very different purposes and the purpose determines almost everything about the design. Building one view intended to serve all of them is the most common reason dashboards go unused.
Checked frequently and briefly to confirm nothing is wrong. Success is that a normal state can be verified in seconds and an abnormal one is impossible to miss. Density and stability matter; anything decorative competes with the signal.
Used to investigate a question, which means the user needs to slice, filter and drill rather than read. Flexibility and drill-down matter more than immediate legibility, and the design should assume exploration rather than a single glance.
Produced for someone who was not involved in the work and needs the conclusion. These need narrative framing, comparison against a baseline, and enough definition that a reader unfamiliar with the metrics does not misinterpret them.
Watched during a shift and used to decide what to work on next. Real-time behavior, clear queueing and unmissable exception handling matter, and the design has to survive being viewed continuously without fatiguing the person watching it.
Where the audience did not build the metrics and cannot ask what they mean. Definitions, honest handling of gaps, and restraint about what is shown all matter more here, since a confusing figure becomes a support ticket rather than an internal question.
Every additional chart reduces the attention available for the ones that matter.
Someone asks for a metric, it is added, and it is never removed. Requests are cheap to grant and there is no cost visible at the moment of adding.
The cost is real and diffuse: each new tile takes a share of the screen and a share of the reader's attention, and the important numbers get harder to find.
A useful discipline is that adding a chart requires nominating one to remove. It forces the comparison that additive requests never do.
Because nobody knows whether 847 is good. Interpretation requires a comparison — last week, last year, the target, the usual range.
A dashboard of bare figures makes every reader do that work from memory, which means most of them do it badly or not at all.
Showing the comparison alongside the number, and marking what is outside the normal range, is what turns a display of data into something someone can act on.
Dashboards are commonly built from what the data warehouse can produce rather than from what someone needs to decide. The result is a dense grid of accurate, well-rendered charts that nobody consults, because none of them corresponds to a decision anyone actually makes.
The corrective is to start from the decision. What does this person do differently depending on what they see, and how often do they make that choice? A metric that changes no behavior, however interesting, belongs in an exploratory tool rather than on a dashboard someone is expected to check.
This usually reduces the number of visible metrics substantially, which is the point. A dashboard showing six things that drive decisions is used; one showing thirty is scanned once and abandoned, because the effort of locating the relevant number exceeds the value of knowing it.
A figure presented alone cannot be acted on, because the viewer has no way to know whether it is good. Four hundred of something is meaningless without knowing whether last month was three hundred or five hundred, and whether the target was either.
The context that makes a number actionable is usually one of three things: comparison to a previous period, comparison to a target, or comparison to a related segment. Adding one of these turns a display into a signal, and it costs almost no additional space — a small delta or a sparkline alongside the figure is generally enough.
Trend matters more than the current value in most operational contexts. A metric that is below target but improving steadily calls for a different response than one that is above target and falling, and a dashboard showing only the current figure cannot distinguish them.
Dashboards conventionally use color to signal state — red for a problem, green for normal. Color alone is insufficient for a meaningful proportion of users with color vision deficiency, and it degrades further on projected screens, in bright rooms and on poorly calibrated monitors.
The fix is redundant encoding: color supported by shape, position, an icon or a label, so the signal survives if color is lost. This is an accessibility requirement and it also produces a more robust dashboard for everyone, since the meaning no longer depends on display conditions.
The related discipline is reserving alert colors for actual alerts. When the brand accent is also the warning color, or when several statuses share a palette, the viewer has to read carefully to determine whether anything is wrong — which defeats the purpose of a display designed to be understood at a glance.

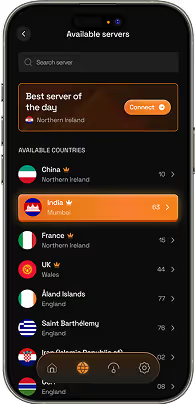
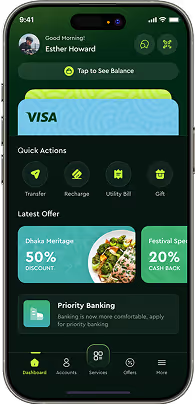


Dashboard UX design structures data screens around the decision they support — selecting metrics that would change that decision, directing attention to anomalies, and providing a path from signal to cause.
Usually because everything on it looks equally important, the numbers have no baseline to compare against, and noticing a problem offers no way to investigate it.
Fewer than it does. A useful rule is that adding a chart requires nominating one to remove, which forces the comparison that additive requests never do.
Practically, yes. A bare figure cannot be interpreted — nobody knows whether 847 is good without a baseline, a trend or a target alongside it.
Show much less. A phone can carry a few critical indicators and an alert; attempting the full desktop dashboard on a small screen produces something nobody reads.
As many as drive decisions for its intended user, which is usually far fewer than the number available. A monitoring view might need five or six. An analytical tool can support more because the user is actively exploring rather than scanning. The useful test is whether every visible metric would change someone’s behavior if it moved; anything that would not belongs elsewhere.
Rarely. An executive needs outcomes and trends; an operational manager needs today’s queue and exceptions; a specialist needs detail in their own area. A single view serving all three either overwhelms the first or under-serves the third. Role-based defaults, with the ability to look further if wanted, generally work better than one shared screen.
Settle the definition, then display it where the figure appears. Most disputes about dashboard numbers are definition disputes rather than data errors — two teams counting slightly different things and each believing the dashboard is wrong. A visible definition at the point of use resolves the argument permanently and costs a tooltip.
Only where decisions are made in real time. Live updating on a dashboard reviewed weekly adds cost and distraction without benefit, and constantly shifting figures make trends harder to read. What every dashboard does need is a clear indication of how current the data is, since acting on figures assumed to be live but actually hours old is worse than knowing they are delayed.
Usually one of four things: it answers questions nobody asks, it takes too long to find the relevant figure, its numbers are not trusted, or it was built for a decision that has since changed. The trust problem is the hardest to recover from — once a user has been misled by a figure once, they verify elsewhere from then on and the dashboard has lost its purpose.
Still deciding if dashboard ux design is right for you?
Talk to UsSomeone asks for a metric on the dashboard. It exists in the warehouse, the query is simple, and adding a tile takes an afternoon. There is no reason to refuse.
What is not visible at that moment is the cost, because it lands somewhere else: on every future reader, who now has one more thing competing for the attention that should have gone to the number that mattered.
Twenty such decisions later, the dashboard contains everything and communicates nothing — and every individual addition was reasonable.
Send us your dashboard and tell us who uses it. We will identify which metrics support a decision and which are taking up attention.